



Power BI & Excel dashboard design
500ر.س
Product description
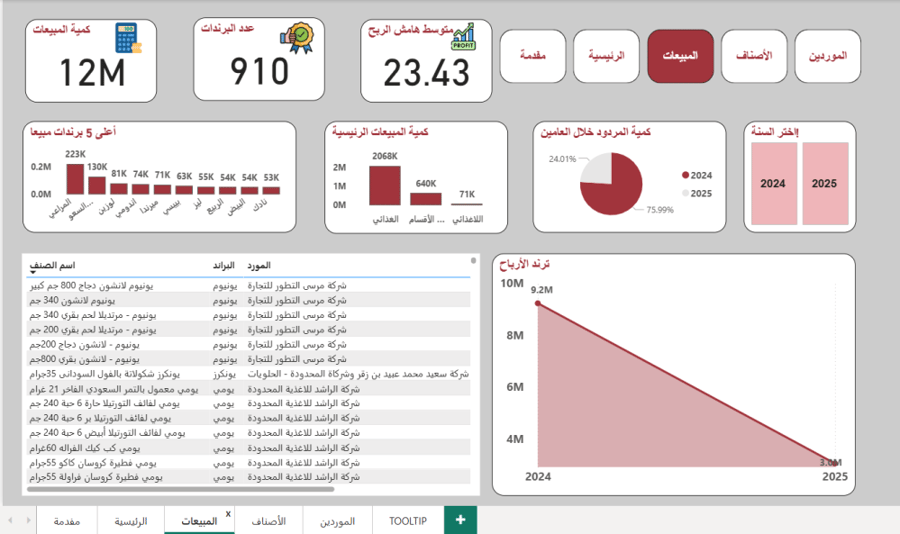
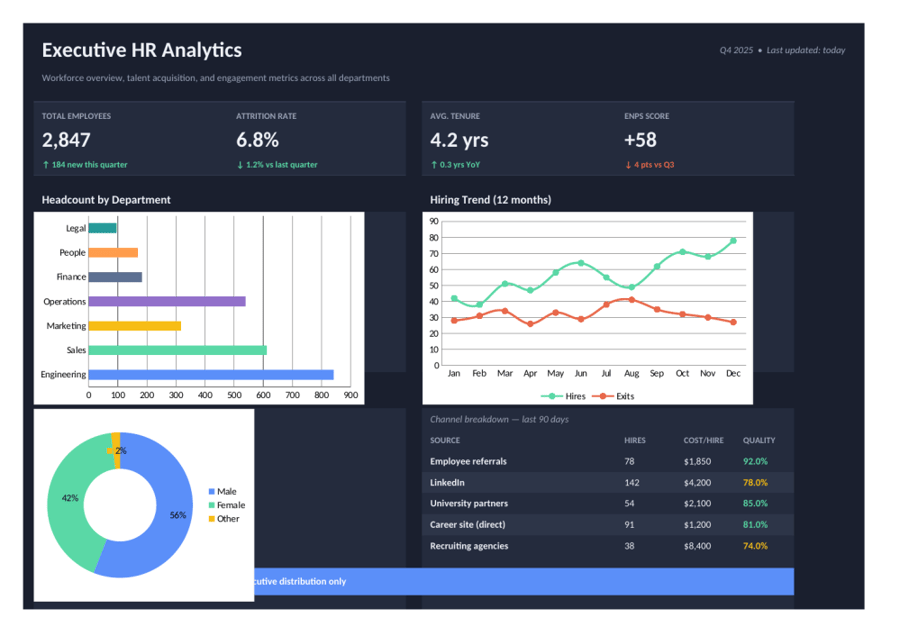
Interactive Dashboard Design Service – Power BI Dashboard A solution designed for entrepreneurs, trainers, and organizations who want to see their data clearly… and make faster decisions. If your data is large, scattered in tables, or difficult to track daily—Tawal transforms it into smart dashboards that help you see the full picture at a glance. What exactly do we do for you? • Design of interactive dashboards with a simple and professional interface • Convert raw numbers into clear KPIs • Analyses including: financial performance, customers, products, sales channels • Direct integration with Excel – Google Sheets – e-commerce stores – databases • Real-time filtering and analysis tools (Regions – Categories – Dates – Segments) • Export dashboards as PDF or an interactive link ready for sharing • Technical support and dashboard explanation to ensure proper use Available packages: 1) Basic Analysis Package for individuals and small project owners who want one clear dashboard: • One interactive dashboard • One data source • Basic indicators (sales – customers – operations) • Simple and straightforward design • Delivery within 3 days • Export as PDF / interactive link 2) Business Intelligence Package for activities needing deeper analysis and more organized data: • Up to 3 interactive dashboards • Integration of multiple data sources • Analyses of categories – regions – dates • Design aligned with visual identity • Technical support for 7 days • Delivery within 4–6 days 3) Implementation Analysis Package for companies and organizations relying on data for decision-making: • Multiple dashboards according to your needs • Direct connection with databases or APIs • Fully customized design • Advanced analyses (comparisons – forecasts – What-If scenarios) • Preparation of ready-to-present executive reports • 30 days technical support • Delivery within 5–10 days (depending on data size) Why choose Tawal? Because we don’t just design a dashboard, we organize your data in a way that supports decision-making, and clarify for you: What happens? Why does it happen? What is the next step? Our dashboards help you monitor your project’s performance moment by moment… effortlessly and without complexity. Ready to move from random tables to a clear vision? Order your package now and start managing your project data professionally.

From Bishah