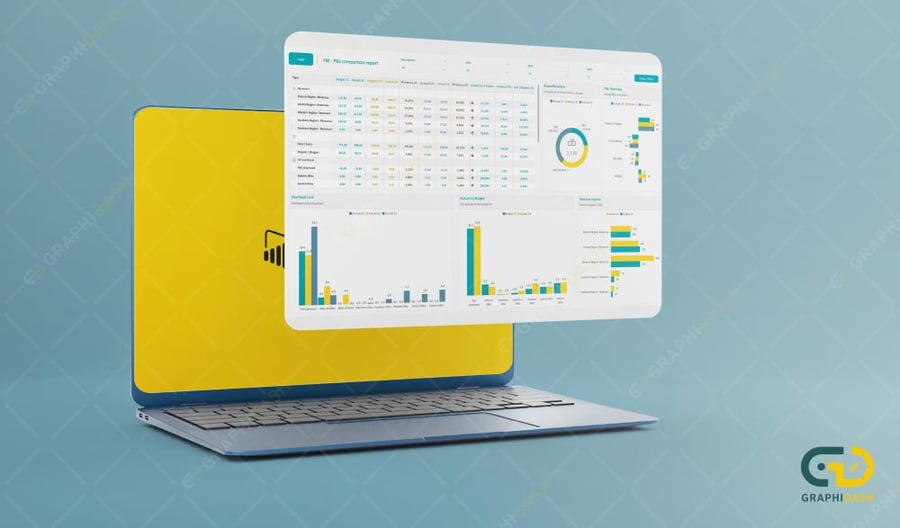
Dashboard an interactive panel for financial performance
499ر.س
Product description
1. General description: The financial performance dashboard is an analytical tool that provides an overview of the organization's financial situation. This dashboard helps the finance team monitor revenues and expenses and make data-driven decisions. 2. Main categories: Revenue analysis: Display of monthly and annual revenues, comparison of revenues with set targets. Expense tracking: Recording monthly expenses by categories (such as salaries, rents), identifying areas that need expense reduction. Cash flows: Monitoring incoming and outgoing cash flows, evaluating available cash balance. Profit and loss assessment: A brief display of profits and losses, identifying periods when the organization achieved profits or losses. Used programs: Power Bi, Excel, Google Sheet

From Riyadh