
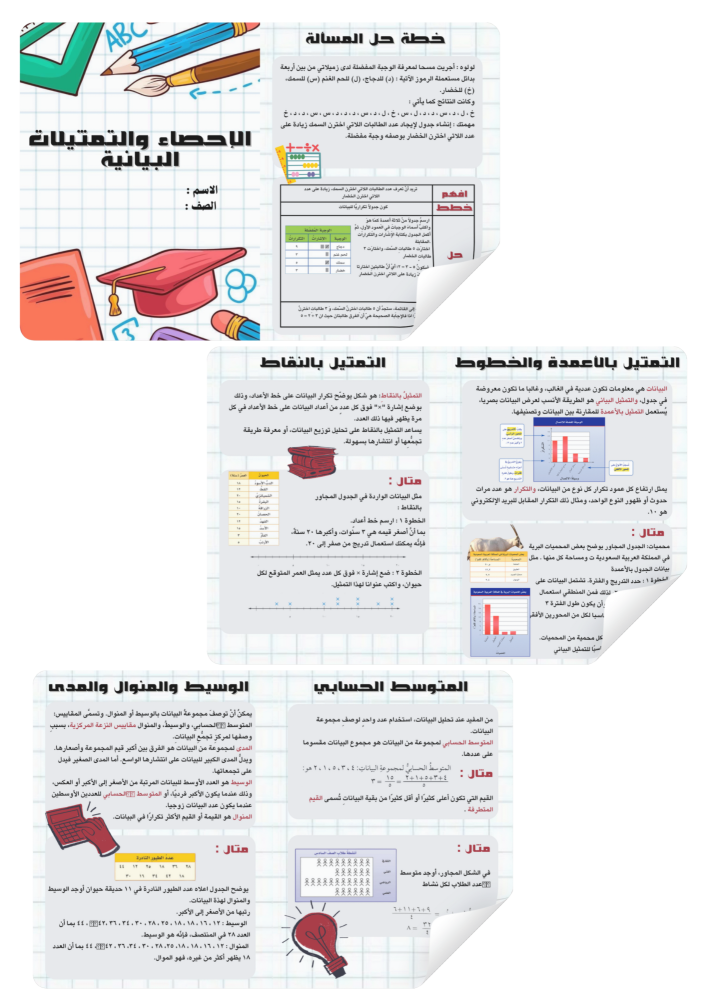
Statistics and Graphical Representations brochure for sixth grade elementary
10ر.س
Product description
Statistics and Graphical Representations brochure for sixth grade elementary mathematics, consisting of 3 pages covering the lessons (problem-solving plan, bar and line representations, dot representation, mean, median, mode, and range). It is printed on A4 paper, then cut in half, and the pages are assembled after cutting. The papers are stapled on the right side of the page to form a booklet resembling a notebook. The file is delivered immediately after purchase.

From Jeddah