Statistics brochure and graphical representations - Mathematics B6 Part 1 PDF
9ر.س
Product description
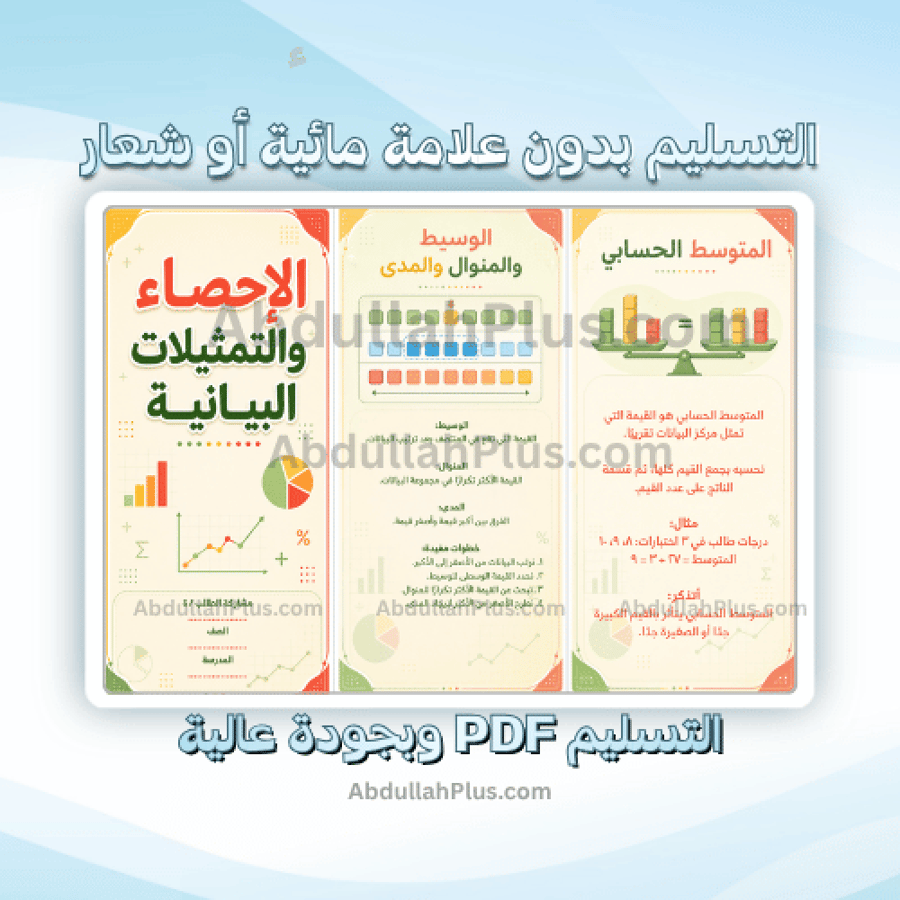
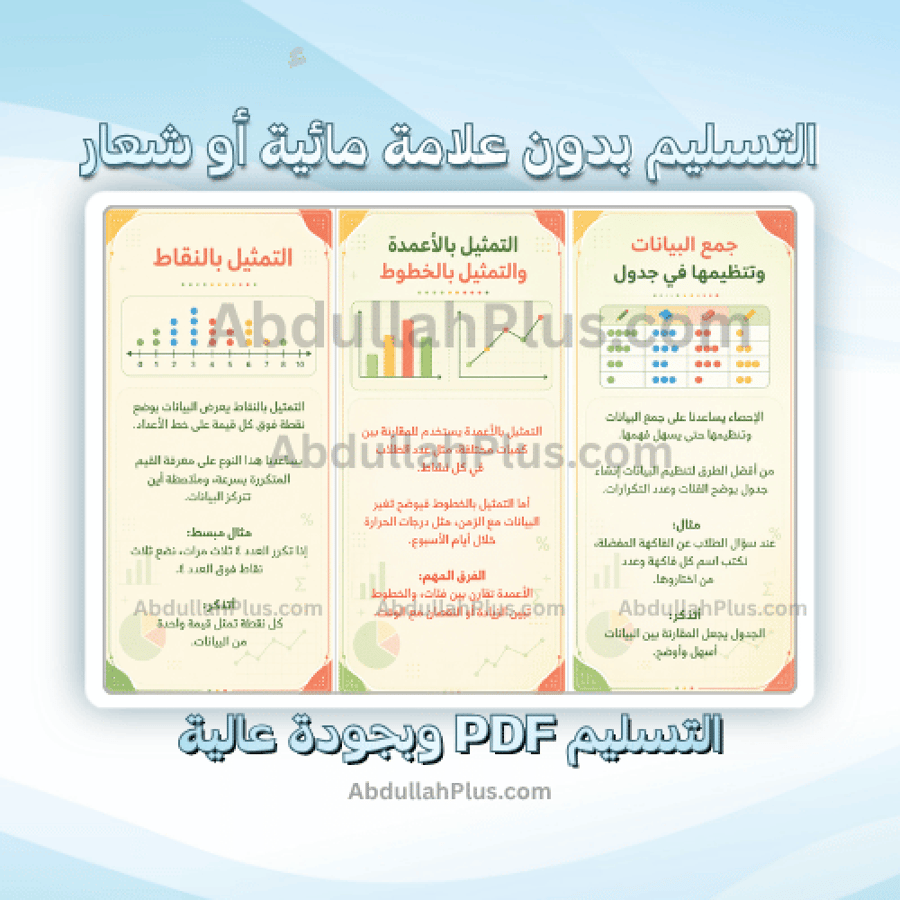
Statistics and Graphical Representations Brochure - Sixth Grade Mathematics First Semester (Ready for Printing PDF) Are you looking for an innovative and comprehensive educational tool that summarizes mathematics in an engaging visual style? We present to students the Statistics and Graphical Representations brochure designed for Sixth Grade students for the first semester. This brochure is carefully and professionally designed to be the perfect tool for quick review and reinforcing basic mathematical concepts in a simple and organized way. Features of the Sixth Grade Statistics and Graphical Representations Brochure Professional and organized design: The brochure comes in A4 horizontal size, divided into 3 columns on each side, and prepared for double-sided printing (tri-fold) to give you a neat geometric shape and easy navigation. Suitable for students: Appropriate for all students to help them excel academically and present distinguished school projects. Modification and direct delivery: After completing the purchase, the student’s data will be added to the brochure, and the file will be sent in a ready-to-print PDF format via WhatsApp directly, in a completely clear copy without any watermark. Contents of the Sixth Grade Mathematics Brochure First Semester The brochure covers all lessons and basic concepts of statistics and graphical representation skills taught in the curriculum: Main cover: Attractive design including the subject name and student data. Data collection and organization: Simplified explanation of how to collect data and organize it within a structured frequency table. Bar and line representations: Visual clarification of how to draw and interpret data using bar and line graphs. Dot representation: An easy and innovative way to display and distribute data with dots. Arithmetic mean: Explanation of the mean formula and how to calculate it accurately. Median, mode, and range: A comprehensive summary and clear formulas for determining the median, mode, and range for any data set. How to request and receive the brochure Click the purchase button and complete the order. Write the student’s data to be added in the notes. Our team will prepare the brochure and send it directly to you as a high-quality, ready-to-print PDF file via WhatsApp.

From Wadi ad-Dawasir