



Personal Finance Manager - Excel - FinanceMaster
150ر.س
350ر.س-57%Product description
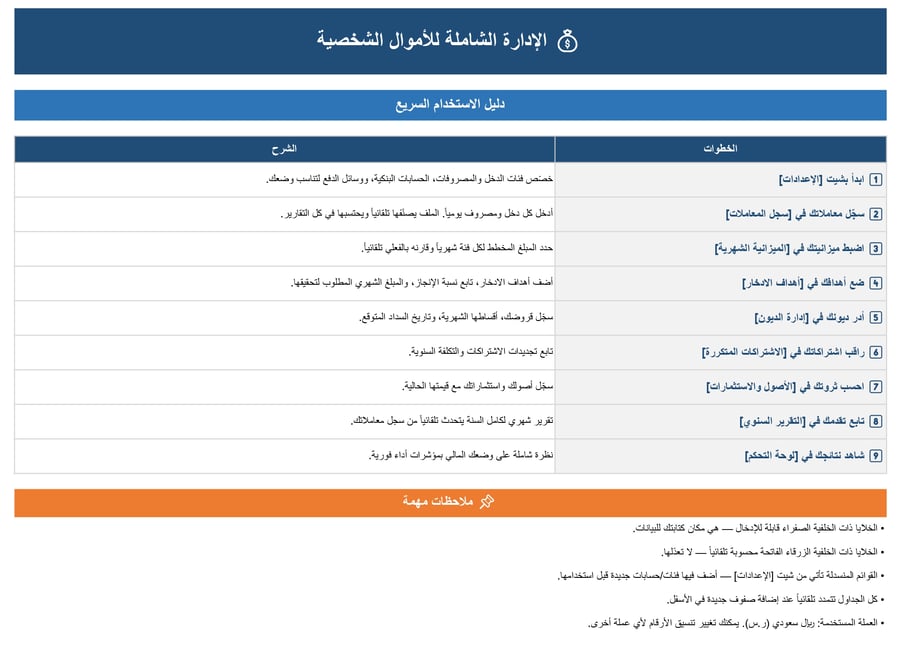
Take complete control of your money with FinanceMaster — a comprehensive, Arabic-first personal finance management system built entirely in Excel. No expensive apps, no monthly subscriptions, no privacy concerns. Just open the file and start managing your money like a pro from day one.
🎛️ Interactive Dashboard
- All-in-one financial overview on a single screen
- 11 real-time KPI cards covering every aspect of your finances
- Live calculation of total income, total expenses, net savings, and savings rate
- Average monthly spending — calculated automatically
- Active goals counter — see how many goals you're working toward
- Total outstanding debt and total monthly debt installments — at a glance
- Total monthly subscription cost — auto-calculated
- Total asset value — auto-calculated
- Net worth indicator (Assets − Debts) — large display, updated instantly
- Year selector — switch between fiscal years with one click
- Last update date — auto-populated with today's date
📝 Transaction Log
- Capacity for 500 transactions (easily expandable)
- Auto-classified by type: Income or Expense
- Auto-extracted month and year from transaction date
- Searchable description field for every transaction
- Linked to bank account and payment method
- Color-coded transaction types (green for income, red for expense)
- Real-time totals at the top: total income, total expenses, net flow, transaction count
- Dropdown selection for type, category, account, and payment method — no typos
📊 Monthly Budget
- Plan vs Actual comparison for every income and expense category
- Auto-pulled actual amounts from the transaction log
- Variance calculation — see exactly how much over or under budget you are
- Achievement percentage with visual data bars
- Smart status indicator: "Within Budget", "Over Budget", "Under Target", or "Goal Met"
- Color-coded status (green/yellow/red) for instant visual feedback
- Total income, total expenses, and net savings — calculated automatically
- Month and year filter — review any month from any year
🎯 Savings Goals
- Track up to 50 savings goals (expandable)
- Goal name, category, target amount, and current saved amount
- Auto-calculated remaining amount needed
- Auto-calculated months remaining until due date
- Auto-calculated required monthly deposit to reach your goal on time
- Achievement percentage with progress data bars
- Status tracking: Active, Completed, Delayed, or Postponed
- Color-coded status indicators
- 5 KPI cards: total goals, active goals, total target, total saved, overall completion %
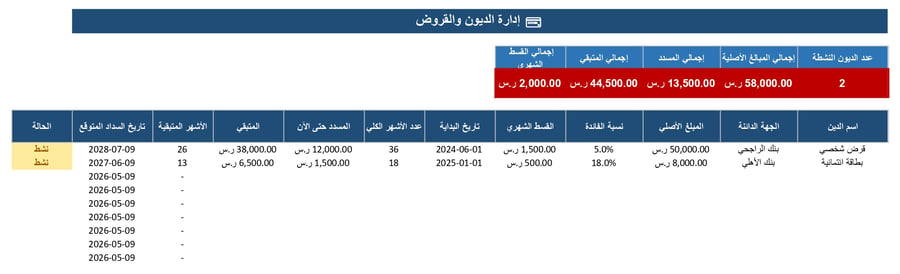
💳 Debt Management
- Track up to 30 debts and loans (expandable)
- Debt name, creditor, original amount, and interest rate
- Monthly installment and total payment months
- Auto-calculated remaining balance
- Auto-calculated months remaining to full repayment
- Auto-calculated expected payoff date — based on TODAY()
- Status tracking: Active, Completed, Delayed, or Postponed
- Color-coded status (green for paid off, yellow for active, red for delayed)
- 5 debt KPIs: count of active debts, total original principal, total paid, total remaining, total monthly installment
🔄 Recurring Subscriptions
- Track up to 30 recurring subscriptions (expandable)
- Supports 4 frequencies: Monthly, Quarterly, Semi-Annual, and Annual
- Auto-calculated monthly cost equivalent for any frequency
- Auto-calculated annual cost
- Auto-calculated days until next renewal
- Smart renewal alerts: red highlight for renewals within 7 days, yellow for within 30 days
- Status tracking for each subscription
- 5 KPI cards: total subscriptions, active count, total monthly cost, total annual cost, count of renewals due within 30 days
📈 Assets & Investments
- Track up to 30 assets (expandable)
- 8 pre-loaded asset types: Real Estate, Stocks, Mutual Funds, Gold, Cash/Deposits, Vehicle, Jewelry, Other
- Purchase price and current value tracking
- Auto-calculated profit or loss per asset (color-coded green/red)
- Auto-calculated return percentage per asset
- Auto-calculated holding period in days
- 5 portfolio KPIs: asset count, total purchase value, total current value, total profit/loss, overall return %
📅 Annual Report
- Full 12-month financial breakdown for any year
- Monthly income, expenses, net savings, and cumulative savings — all auto-calculated
- Monthly savings rate as a percentage
- Detailed expense breakdown by all 15 categories across all 12 months
- Annual totals column for every line
- Color-scaled heatmap on category amounts — instantly spot your biggest spending months
- Year selector — view any year on demand
⚙️ Settings & Customization
- 9 fully customizable reference lists: income categories, expense categories, bank accounts, payment methods, transaction types, statuses, payment frequencies, asset types, and a master category helper list
- All dropdown menus pull from these lists — update once, applies everywhere
- Configurable general settings: user name, fiscal year, default monthly salary, target savings rate
- Configurable document alert thresholds
✨ Built-in Professional Features
- 100% production-ready
- Excel Tables that auto-expand when you add new rows — no manual formula copying
- Conditional formatting throughout: color-coded statuses, data bars for progress, color scales for heatmaps
- Right-to-left (RTL) layout — perfectly designed for Arabic
- Pre-configured for Saudi Riyal (SAR) currency
- Date format optimized for the region (yyyy-mm-dd)
- Sample data included in every sheet — see exactly how to use it
- Color convention: yellow cells = your input, light blue cells = auto-calculated (don't edit)
- Hidden helper columns keep your dashboard clean
- Works with Excel
- No macros, no VBA, no security warnings — pure Excel formulas only
- One-time purchase — no subscriptions, no recurring fees
- Complete data privacy — your financial data never leaves your computer