

Graph package
79ر.س
199ر.س-60%Product description
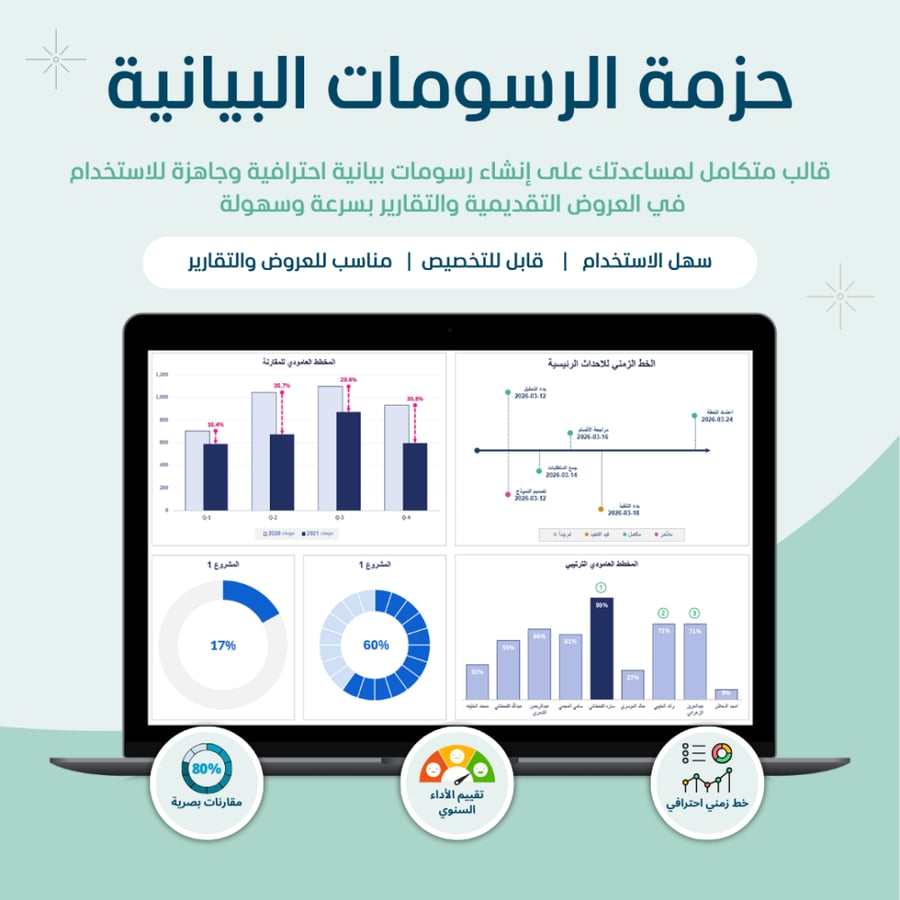
A practical template designed to help you create a variety of professional charts clearly and easily editable. Suitable for anyone who needs a quick and organized way to display charts within presentations like PowerPoint or reports.
What does this template offer you?
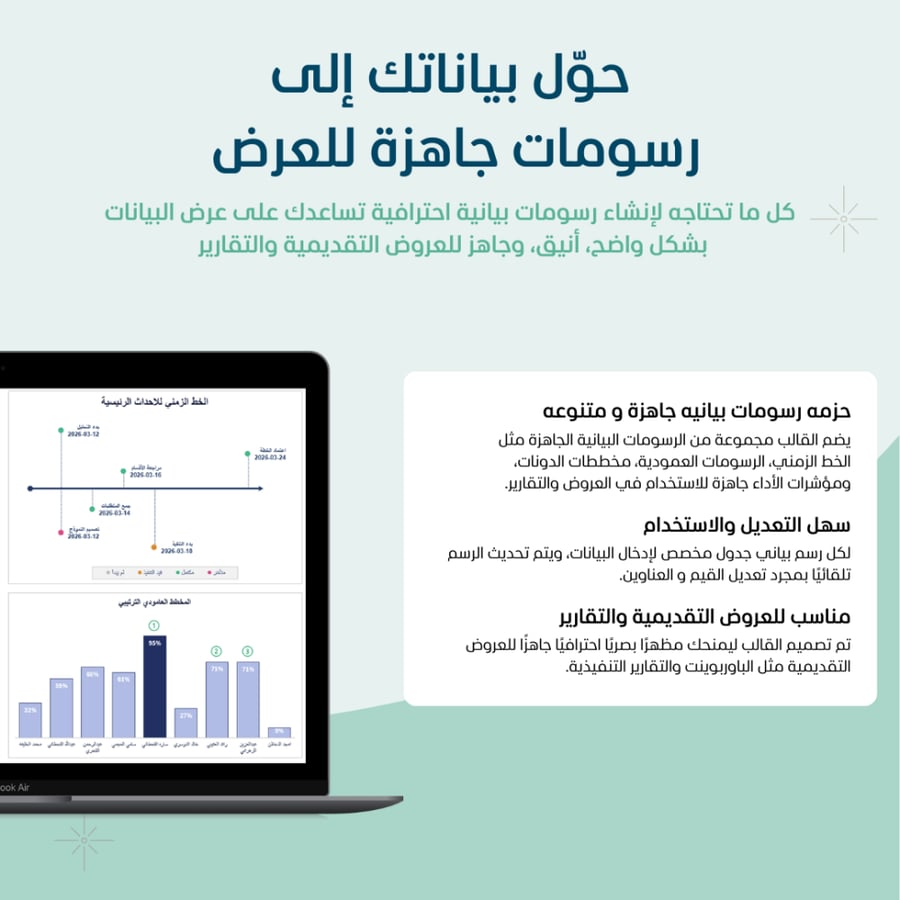
- A variety of ready-made charts
The template provides several types of professional charts within a single file, so you can choose what suits your data and presentation style, such as:
Milestones and event timeline
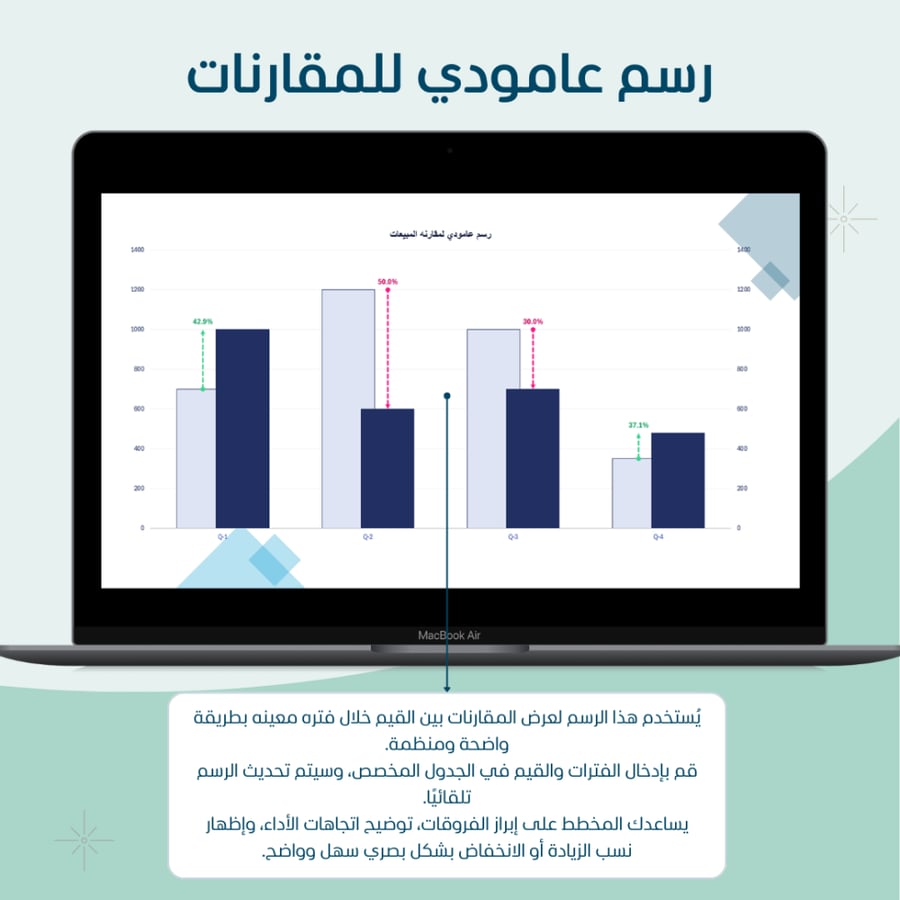
Comparison bar chart
Ordinal bar chart
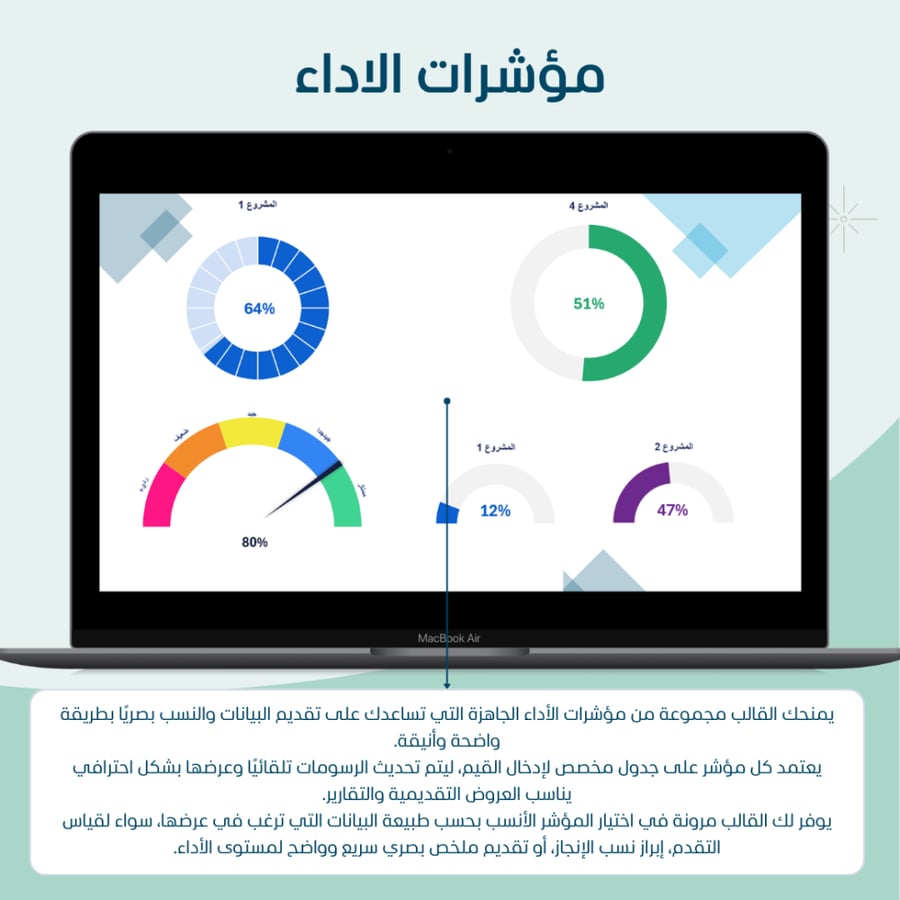
Donut charts of various types
Performance scale charts
Ease of use and updating
Each chart has a dedicated table for data entry, and once you modify the values or titles, the chart updates automatically in a clear and organized manner.
High readiness for presentations and reports
The charts are designed with an elegant and professional visual style, making them suitable for presentations (PowerPoint), management reports, and dashboards.
Flexibility in data presentation
Whether you want to show comparison, achievement percentage, element ranking, performance indicator, or timeline, you will find the appropriate shape inside the template to present your data more clearly.
Time and effort saving
Instead of building charts from scratch each time, you will get ready-made, well-organized templates that help you produce professional data output in less time.
Ideal for:
Business owners and projects
Analysts and reporting teams
Project managers
Presentation specialists
Anyone who needs to display their data professionally and clearly
Important notes:
Works on Excel 2019 or later on desktop.
Do not delete any sheets or columns inside the template to avoid formula issues.
Data links automatically between sheets — just enter it in the designated cells.
The template is open source.
Does not include custom modifications for each client.

From Al Khobar